Digital Signage and Reporting
Turn kiosk interactions into actionable analytics and business insights
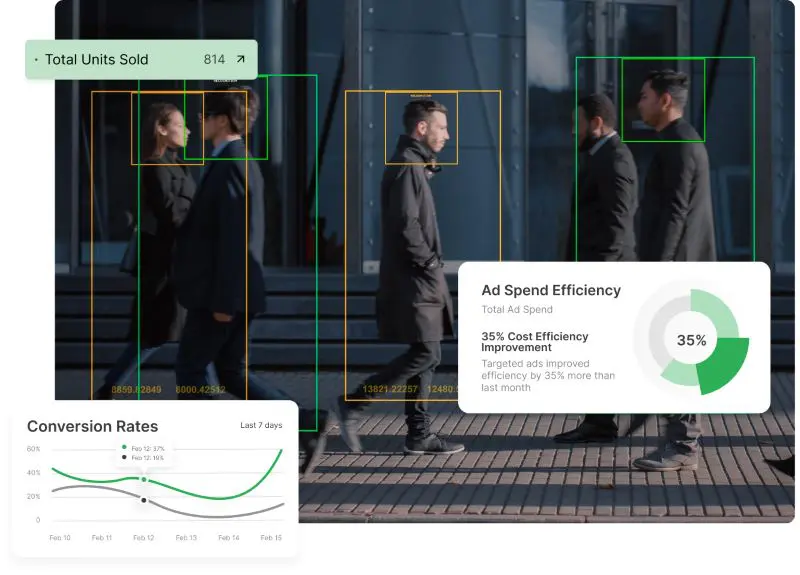
Provide real-time insights into usage, performance and customer behavior – enabling continuous optimization and data-driven decision-making that helps turn taps into purpose-driven outcomes.

Trusted by industry leaders to power better customer experiences
Dashboards and Reporting
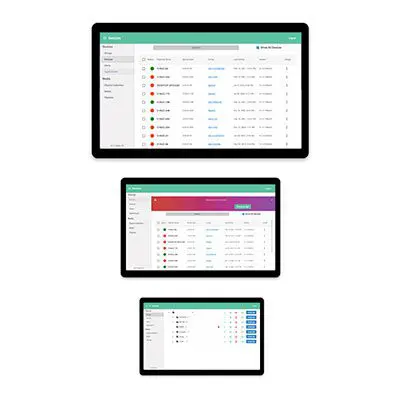
Provide real-time operational visibility
Allow your team to better monitor performance, usage patterns, uptime and service issues effectively, while offering valuable insights into user behavior that reveals how customers engage and where improvements can be made.
-
 Enhance functionality, operational visibility and performance tracking in real-time
-
 Reveal user behaviors with interactions that highlight popular features, drop-off points and engagement trends that inform design and content improvements
-
 Enhance overall user experience while streamlining operations with clear metrics and trends


Analytics
Reveal deeper patterns and trends between user experience and resulting outcomes
Analyze behavior, usage and preferences to deliver frictionless user engagements that elevate connections to your brand, while prompting increased spend.
-
 Deliver tailored content and interactions, improving personalized engagement and satisfaction
-
 Uncover deeper patterns and correlations, helping organizations make smarter, data-backed decisions about placement, features and future investments
-
 Anticipate usage trends and potential issues, enabling improved interactions, predictive maintenance and reduced downtime
AI and Next-Generation Capabilities
Transform kiosks into intelligent, AI-powered service platforms
Redefine self-service with AI that thinks, sees and speaks. Harness the power of voice, vision and generative intelligence to deliver hyper-personalized, accessible and intuitive experiences – turning static interactions into dynamic, conversational journeys that scale effortlessly.
-
 Make every interaction easier and more welcoming with intuitive, accessible experiences tailored to diverse users
-
 Turn customer data into personalized prompts that drive engagement – suggesting the right products, upsells and offers at the right time
-
 Anticipate issues before they arise to keep systems running smoothly, lighten staff workload and boost reliability with lower costs

Discover the versatility built into each product
Built for Every Environment
Trust in ruggedized, rated, reliable and robust devices of all shapes and sizes that perform flawlessly indoors or out.
Engage and Inform
Guide users through effortless, self-driven, interactive experiences or stream advertisements and promotions 24/7 on optically bonded, enhanced viewing touch screens.
Modular in Design
Easily configure, connect and scale devices to suit different locations, functions and use cases, while streamlining maintenance, serviceability and operational expenses.
Unapologetically Authentic
Fit any space with aesthetics and branding that drives emotional resonance and authentic connections to your true brand.
Industry applications for Reporting and Analytics
Sports Arenas
Guide fans from parking to seats
Interactive paths that simplify navigation and amplify sponsor engagement
Healthcare Facilities
Simplify complex patient journeys
Real-time wayfinding that adapts to emergencies and staffing changes
Retail Spaces
Convert browsers to buyers
Shelf-edge experiences that bridge digital browsing and physical products
More Information
Digital Signage Analytics Solutions: Transforming Data into Strategic Insights
Digital signage analytics revolutionizes how businesses understand and optimize their interactive display investments. By capturing comprehensive data from every customer interaction, organizations gain unprecedented visibility into engagement patterns, content effectiveness, and ROI achievement. Modern kiosk analytics software transcends basic traffic counting, delivering sophisticated insights that drive strategic decision-making across marketing, operations, and customer experience initiatives.
The evolution from static displays to intelligent kiosks creates vast data opportunities. Every touch, dwell time, and navigation path generates valuable information about customer preferences and behaviors. This real-time intelligence enables businesses to adapt content strategies dynamically, optimize user interfaces based on actual usage patterns, and demonstrate tangible returns on digital infrastructure investments.
Interactive Display Analytics Framework
Comprehensive interactive display analytics encompasses multiple data layers working together to create actionable insights. User engagement metrics capture interaction frequency, session duration, and navigation patterns. Content performance analytics reveal which messages resonate with audiences and drive desired actions. Technical performance monitoring ensures optimal system availability and responsiveness.
Touch screen analytics dashboards visualize these complex data streams through intuitive interfaces. Heat maps reveal high-interaction zones guiding interface optimization. Funnel analysis tracks user journeys from initial engagement through conversion—comparative analytics benchmark performance across locations, periods, and content variations, enabling data-driven optimization strategies.
Real-Time Kiosk Reporting Capabilities
Real-time reporting transforms raw interaction data into immediate operational intelligence. Managers monitor current usage levels, identifying peak periods and adjusting staffing accordingly. Content teams track campaign performance as it happens, enabling rapid adjustments to maximize impact. Technical teams receive instant alerts about performance issues, minimizing downtime and ensuring consistent user experiences.
Live dashboards display key performance indicators customized to organizational priorities. Retail environments might focus on conversion rates and average transaction values. Healthcare facilities prioritize reducing wait times and improving wayfinding efficiency. Corporate installations track employee engagement and the effectiveness of information dissemination. This real-time visibility enables proactive management rather than reactive troubleshooting.
Digital Display Performance Metrics That Matter
Effective measurement requires focusing on metrics that align with business objectives. Engagement metrics, including touch frequency, session duration, and interaction depth, indicate content relevance and interface usability. Conversion metrics track progression from initial interaction to desired outcomes, whether completing transactions, capturing leads, or accessing specific information.
Operational metrics ensure technical excellence and user satisfaction. System uptime percentages validate reliability investments. Response time measurements confirm interface responsiveness. Error rates identify usability issues requiring attention. These performance indicators create comprehensive views of both user experience quality and technical infrastructure health.
Customer Behavior Analytics Through Kiosk Interactions
Understanding customer behavior through kiosk interactions provides insights unavailable through traditional analytics methods. Path analysis reveals how users navigate through content, identifying popular routes and potential confusion points. Dwell time analysis indicates content engagement levels and optimal message duration—abandonment tracking highlights where users disengage, signaling opportunities for interface improvement.
Demographic inference through interaction patterns enables targeted content delivery without invasive data collection. Time-of-day analysis reveals audience composition changes throughout operating hours. Repeat usage patterns identify loyal users and their preferences. These behavioral insights inform both immediate content decisions and long-term strategic planning.
How to Track Kiosk Usage Analytics Effectively
Implementing effective kiosk usage analytics requires strategic planning beyond simply collecting data. Begin by defining clear objectives aligned with business goals. Identify key performance indicators that directly relate to success metrics. Establish baseline measurements enabling progress tracking over time.
Data collection strategies must balance comprehensiveness with privacy considerations. Anonymous interaction tracking provides valuable insights while respecting user privacy. Aggregated reporting protects individual identity while revealing population-level trends. Clear data retention policies ensure compliance with regulations while maintaining historical comparison capabilities.
Interactive Kiosk Data Insights for Strategic Planning
Transform raw analytics into strategic insights through systematic analysis approaches.—Segment data by location, period, and user behavior patterns to identify optimization opportunities. Compare performance across different hardware configurations to guide future investments. Analyze content performance variations to refine messaging strategies.
Predictive analytics leverages historical patterns to forecast future performance. Seasonal trend analysis guides content planning and resource allocation. Usage growth projections inform capacity planning decisions. These forward-looking insights enable proactive strategy development rather than reactive adjustments.
Digital Signage ROI Measurement Methodologies
Quantifying digital signage ROI requires comprehensive measurement approaches encompassing both direct and indirect benefits. Direct revenue attribution tracks sales influenced by display interactions. Cost savings calculations include reduced printing expenses, decreased staff requirements, and improved operational efficiency. Customer satisfaction improvements, while harder to quantify, significantly impact long-term business success.
ROI frameworks must account for the total cost of ownership, including software licensing, maintenance, and content creation. Benefit calculations should include both immediate returns and cumulative advantages over system lifespans. Comparative analysis against traditional alternatives demonstrates relative value propositions. These comprehensive assessments justify continued investment and guide expansion decisions.
Retail Analytics Dashboard Applications
Retail environments exemplify sophisticated analytics applications driving measurable business improvements. Product interaction tracking reveals browsing patterns and purchase consideration processes. Promotional effectiveness measurement compares campaign performance across locations and periods. Queue management analytics optimize staffing levels and reduce customer wait times.
Integration with point-of-sale systems enables closed-loop attribution, connecting display interactions to actual purchases. Inventory level integration allows dynamic content adjustment based on stock availability. Customer journey mapping across physical and digital touchpoints creates a holistic understanding of shopping behaviors. These retail-specific applications demonstrate analytics value in driving revenue and operational efficiency.
Touch Point Analytics Software Integration
Modern touch point analytics software integrates seamlessly with existing business intelligence ecosystems. API connections enable data flow to enterprise analytics platforms. Standard reporting formats facilitate incorporation into executive dashboards. Real-time data streams support operational monitoring systems.
Integration considerations include data format standardization, synchronization frequency, and security protocols. Webhook capabilities enable event-driven notifications for critical thresholds. Batch export functions support detailed offline analysis. These integration capabilities position kiosk analytics as components within broader digital transformation initiatives.
Real-Time Customer Interaction Data Applications
Real-time customer interaction data enables immediate response to changing conditions. Dynamic content adjustment based on current engagement levels optimizes message relevance. Automated A/B testing continuously improves interface elements and content effectiveness. Personalization engines deliver targeted experiences without storing personal information.
Operational applications include dynamic resource allocation based on current demand. Predictive maintenance scheduling prevents failures before they impact users. Performance optimization automatically adjusts system parameters, maintaining optimal responsiveness. These real-time capabilities transform static digital signage into responsive, intelligent systems.
Interactive Display Engagement Metrics Best Practices
Establishing effective engagement metrics requires balancing comprehensiveness with actionability. Focus on metrics directly tied to business objectives rather than vanity statistics. Implement consistent measurement methodologies enabling valid comparisons across time and locations. Regular metric review and refinement ensure continued relevance as objectives evolve.
Best practices include establishing clear metric definitions understood across organizations. Automated reporting reduces manual effort while ensuring consistency. Anomaly detection alerts identify unusual patterns requiring investigation. Regular metric audits validate continued alignment with business priorities. These practices ensure analytics investments deliver sustained value.
Kiosk Conversion Rate Tracking Strategies
Conversion rate tracking extends beyond simple transaction completion to encompass various micro-conversions throughout user journeys. Define conversion events aligned with specific display objectives. Track progression through conversion funnels, identifying drop-off points. Implement attribution models accounting for multi-touch interactions influencing final conversions.
Advanced tracking strategies segment conversion rates by user characteristics, periods, and content variations. Cohort analysis reveals how different user groups progress through conversion paths. Multivariate testing identifies optimal combinations of interface elements and content. These sophisticated tracking approaches enable precise optimization targeting the highest-impact improvements across all industries.


